#1
Technical
Critical (3)
Let people skip repeated menus and get to the main content
WCAG 2.4.1 — Bypass Blocks
31 open instance(s) across 18 page(s).
Skip link must target the main content landmark — theme template fix.

Prepared by FIREANT STUDIO for Internet2
WCAG 2.2 AA
10
10 open content priorities.
18,313
Page views (Jul 1, 2026–Jul 31, 2026)
60
Pages evaluated in depth.
12
0
12 in July scan.
All resolved.
Following the July 2026 accessibility audit, this report gives a clear picture of where internet2.edu stands today — what was fixed in the theme and infrastructure, what content teams can tackle in WordPress, and which high-traffic pages deserve attention first.
Our review targeted WCAG 2.2 AA and focused on 60 pages evaluated in depth — the URLs that carry the most weight for members and partners. Traffic in Jul 1, 2026–Jul 31, 2026: 18,313 page views from all channels and 8,259 organic Google Search clicks across this sample. Search clicks count only people who arrived from Google to that exact URL; page views include direct visits, email, internal links, and other sources. 84% of sample search clicks went to the homepage. Findings combine automated scans, manual expert review, and live-page checks so they reflect what people experience in the browser.
The evaluated sample enters this cycle from a solid baseline: composite health score 94.7 out of 100, with the ten most-searched sample URLs averaging 93.5 on Lighthouse accessibility. That does not mean the work is finished — it means the remaining backlog is concentrated and actionable rather than site-wide.
When the July audit closed, we tracked 4 theme-level technical items — patterns in the WordPress theme, navigation, or shared components that affect keyboard and screen reader users across many pages. A separate site-status scan also flagged 12 broken author archive URLs (server errors on legacy author pages listed in the sitemap). Those items are listed in detail on the Technical tab and, for URL status, under Site checks.
Since July, the tracked technical queue is fully addressed: 1 item was fully fixed in the theme or platform, and 3 were closed this cycle after review (triaged as resolved for reporting or deferred with documented rationale). No technical items remain open in the current progress view. All 12 author archive errors from the July scan have also been cleared.
When you plan the next content sprint, these four areas give the most return for members and partners who use assistive technology or mobile devices.
The largest remaining body of work sits on the Content tab: 10 fix categories that your content team can address in WordPress — link text, image descriptions, heading order, data tables, color contrast on page styles, and similar patterns that repeat across templates. These are not theme defects; they are editorial improvements that scale when you fix shared templates and high-traffic pages first.
The table below lists sample pages by page views and open content items so teams can see where effort will reach the most visitors.
Page views (Jul 1, 2026–Jul 31, 2026) counts every visit to the page from any source (direct, email, internal links, search, and more). Google Search clicks (Jul 1, 2026–Jul 31, 2026) counts only people who clicked through from Google Search to this exact URL.
| Page | Content type | Page views (Jul 1, 2026–Jul 31, 2026) | Google Search clicks (Jul 1, 2026–Jul 31, 2026) | Content items to address |
|---|---|---|---|---|
| /community/careers | Community | 968 | 136 | 2 |
| /services | Pages | 663 | 16 | 4 |
| /community/community-leadership-and-culture-initiative/emerging-leaders-scholarship-program | Community | 611 | 24 | 4 |
| /community/about-us | Community | 580 | 88 | 3 |
| /community/membership | Community | 431 | 24 | 0 |
| /cloud/cloud-learning-and-skills-sessions/class-events-schedule | Cloud | 417 | 13 | 6 |
| /network | Pages | 302 | 29 | 5 |
| /community/about-us/executive-leadership | Community | 292 | 31 | 4 |
| /cloud/internet2-net-plus-services | Cloud | 280 | 96 | 9 |
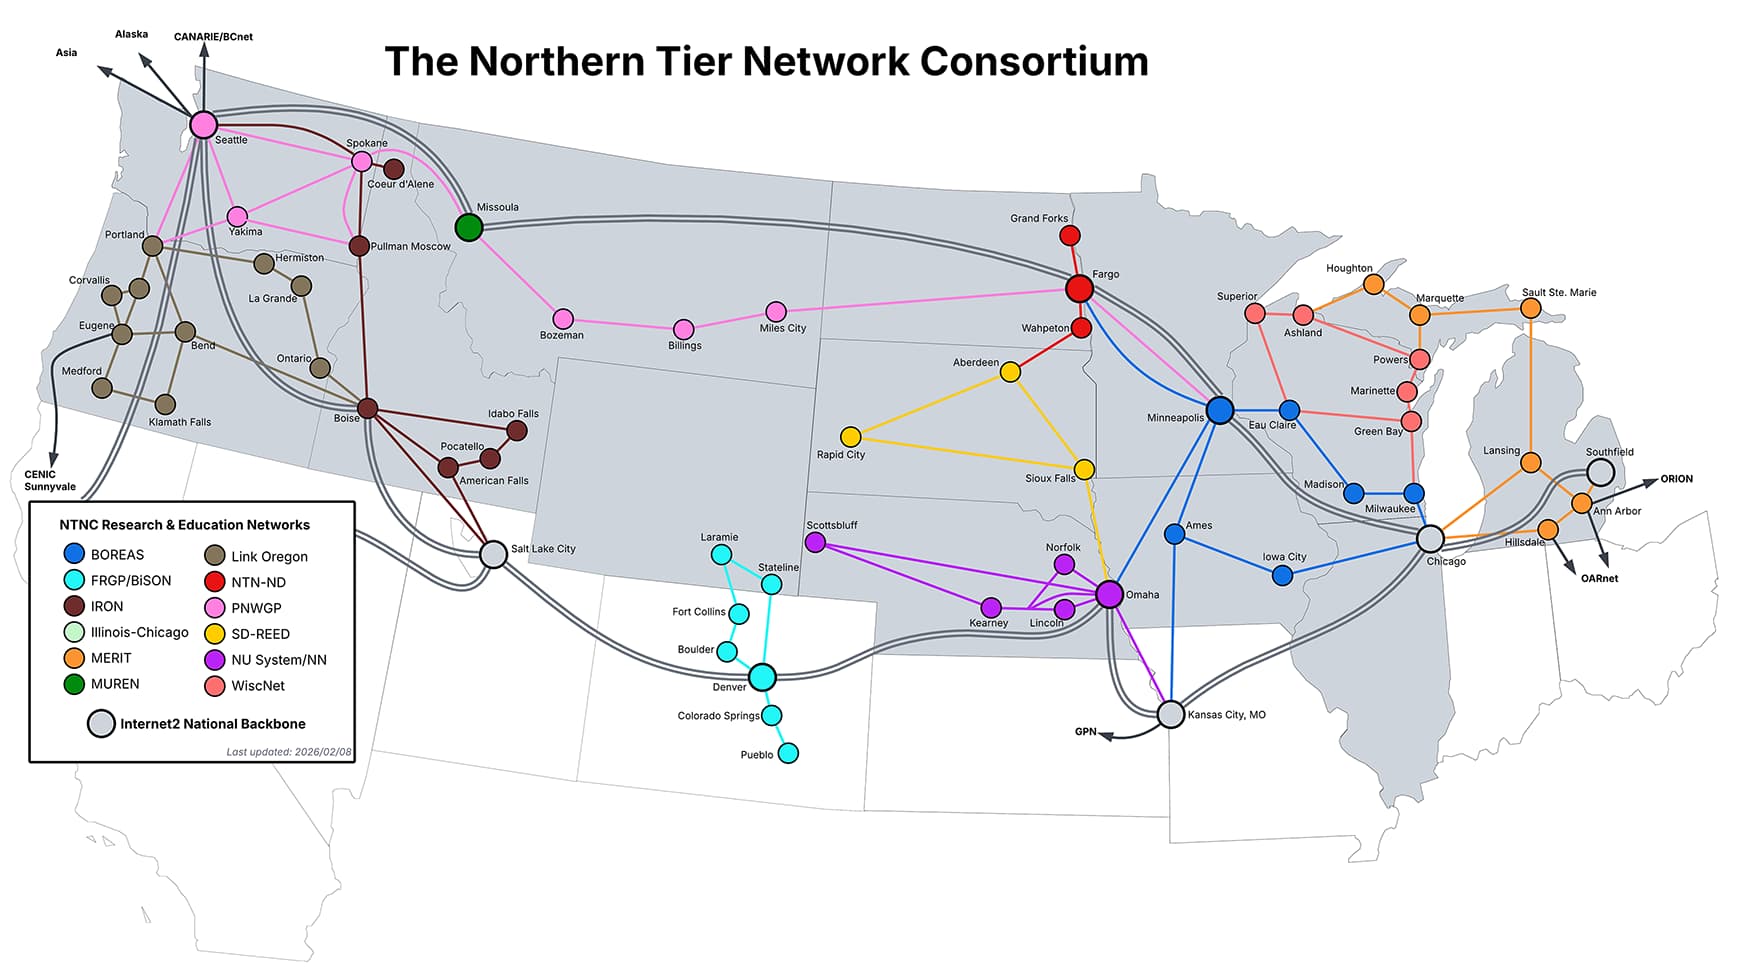
| /northern-tier-network-consortium | Pages | 202 | 35 | 5 |
Critical (3)
WCAG 2.4.1 — Bypass Blocks
31 open instance(s) across 18 page(s).
Skip link must target the main content landmark — theme template fix.
Critical (3)
WCAG 4.1.2 — Name, Role, Value
3,706 open instance(s) across 1,779 page(s).
Screen readers hear “button” with no label — often icon-only or empty controls in the theme or plugins.
Significant (2)
WCAG 2.2.2 — Pause, Stop, Hide
5 open instance(s) across 5 page(s).
Carousel/slider accessibility controls — addressed or dismissed where not published.
Moderate (1)
WCAG 4.1.2 — Name, Role, Value
1,017 open instance(s) across 935 page(s).
Visible UI incorrectly excluded from screen readers — addressed in theme and shared components.
Moderate (1)
WCAG 4.1.2 — Name, Role, Value
1,017 open instance(s) across 935 page(s).
Visible UI incorrectly excluded from screen readers — addressed in theme and shared components.
Critical (3)
WCAG 2.4.1 — Bypass Blocks
18 open instance(s) across 7 page(s).
Skip link must target the main content landmark — theme template fix.
Critical (3)
WCAG 4.1.2 — Name, Role, Value
3 open instance(s) across 2 page(s).
Screen readers hear “button” with no label — often icon-only or empty controls in the theme or plugins.
Significant (2)
WCAG 2.2.2 — Pause, Stop, Hide
5 open instance(s) across 5 page(s).
Carousel/slider accessibility controls — addressed or dismissed where not published.
Start with the pages and patterns below — then use the numbered list for the full set of content priorities.
280 page views (all channels) · 96 Google Search clicks · 9 content items to address
Start here — this page drew 280 visits from all channels in the review window and still needs several content fixes, including a statistics chart that needs a short text description for people who listen to the page instead of viewing it.
114 page views (all channels) · 63 Google Search clicks · 14 content items to address
This page has the most open content items in our review sample — a strong candidate for a focused cleanup pass.
46 links across 25 pages
Phrases like “Read more” or “Click here” are hard to follow when someone hears a list of links out of context. Each link should describe its destination.
Priority #1 in the list below
249 table cells across 170 pages
Program and network pages rely on data tables. Proper headers help people using screen readers follow the rows and columns.
Priority #2 in the list below
Critical (3)
WCAG 2.4.4 — Link Purpose (In Context)
46 open instance(s) across 25 page(s).
Generic link text like “click here” or “read more” — rewrite so the link makes sense out of context.
Critical (3)
WCAG 1.3.1 — Info and Relationships
249 open instance(s) across 170 page(s).
Data tables need proper header cells so assistive technology can read rows and columns correctly.
Significant (2)
WCAG 1.4.3 — Contrast (Minimum)
3 open instance(s) across 2 page(s).
Foreground and background colors fail WCAG AA — adjust in theme or page styles (see workbook Contrast tab for examples).
Significant (2)
WCAG 1.1.1 — Non-text Content
53 open instance(s) across 41 page(s).
Meaningful images need short descriptions in the CMS alt field — start with templates that repeat across many pages.
Significant (2)
WCAG 1.1.1 — Non-text Content
17 image element row(s) on 10 page(s).
Same as above, scoped to the top-traffic pages in this audit sample — quick wins on high-visibility URLs.
Significant (2)
WCAG 2.4.2 — Page Titled
1 page(s).
Browser tabs and search snippets need a title and meta description — update in the CMS for clarity and discoverability.
Significant (2)
WCAG 1.3.1 — Info and Relationships
352 open instance(s) across 315 page(s).
Pages skip heading levels (e.g. H2 then H4) — fix templates so headings follow a logical outline.
Critical (3)
WCAG 1.3.1 — Info and Relationships
37 open instance(s) across 2 page(s).
Inputs without associated labels — usually a form plugin or custom markup issue on a small set of pages.
Significant (2)
WCAG 4.1.2 — Name, Role, Value
17 open instance(s) across 16 page(s).
Embedded frames need a title attribute so screen reader users know what the embed contains.
Significant (2)
WCAG 1.3.1 — Info and Relationships
5 open instance(s) across 4 page(s).
Empty table header cells in table markup — often same stack as missing headers.
| Page title | Page URL | Meta description |
|---|---|---|
| Network Map | https://internet2.edu/infrastructure/i2-network-map/ | Missing meta description |
Same period as search data: Jul 1, 2026–Jul 31, 2026. Page views include all channels; Google Search clicks are organic search only, per exact URL.
60
URLs in the 60-page sample with traffic and PageSpeed data.
18,313
Page views (Jul 1, 2026–Jul 31, 2026).
8,259
Google Search clicks (Jul 1, 2026–Jul 31, 2026).
| Page URL | Page views (Jul 1, 2026–Jul 31, 2026) | Google Search clicks (Jul 1, 2026–Jul 31, 2026) | PageSpeed score | Lighthouse accessibility | Largest paint (lab) | Largest paint (visitors) | Interaction delay (visitors) |
|---|---|---|---|---|---|---|---|
| https://internet2.edu | 9,675 | 6919 | 93 | 93 | 3,151 ms | 3,042 ms | 176 ms |
| https://internet2.edu/community/careers | 968 | 136 | 75 | 94 | 6,536 ms | 2,896 ms | 143 ms |
| https://internet2.edu/services | 663 | 16 | 62 | 94 | 6,404 ms | 2,896 ms | 143 ms |
| https://internet2.edu/community/community-leadership-and-culture-initiative/emerging-leaders-scholarship-program | 611 | 24 | 91 | 93 | 3,451 ms | 2,896 ms | 143 ms |
| https://internet2.edu/community/membership/member-list | 602 | 92 | 75 | 93 | 6,525 ms | 2,896 ms | 143 ms |
| https://internet2.edu/community/about-us | 580 | 88 | 97 | 93 | 1,951 ms | 2,896 ms | 143 ms |
| https://internet2.edu/community/membership | 431 | 24 | 48 | 88 | 16,878 ms | 2,896 ms | 143 ms |
| https://internet2.edu/cloud/cloud-learning-and-skills-sessions/class-events-schedule | 417 | 13 | 75 | 93 | 6,120 ms | 2,896 ms | 143 ms |
| https://internet2.edu/network | 302 | 29 | 44 | 93 | 12,757 ms | 2,896 ms | 143 ms |
| https://internet2.edu/community/about-us/executive-leadership | 292 | 31 | 76 | 93 | 1,999 ms | 2,896 ms | 143 ms |
| Page URL | Page views (Jul 1, 2026–Jul 31, 2026) | Google Search clicks (Jul 1, 2026–Jul 31, 2026) | PageSpeed score | Lighthouse accessibility | Largest paint (lab) | Largest paint (visitors) | Interaction delay (visitors) |
|---|---|---|---|---|---|---|---|
| https://internet2.edu/cloud/cloud-learning-and-skills-sessions | 148 | 15 | 46 | 93 | 17,416 ms | 2,896 ms | 143 ms |
| https://internet2.edu/community/membership | 431 | 24 | 48 | 88 | 16,878 ms | 2,896 ms | 143 ms |
| https://internet2.edu/community/community-group-list | 101 | 10 | 56 | 89 | 12,907 ms | 2,896 ms | 143 ms |
| https://internet2.edu/network | 302 | 29 | 44 | 93 | 12,757 ms | 2,896 ms | 143 ms |
| https://internet2.edu/network/operations-and-support | 40 | 16 | 50 | 90 | 11,725 ms | 2,896 ms | 143 ms |
| https://internet2.edu/community/membership/higher-education-membership | 133 | 9 | 35 | 93 | 11,360 ms | 2,896 ms | 143 ms |
| https://internet2.edu/network/state-and-regional-r-e-networks | 99 | 20 | 50 | 93 | 11,191 ms | 2,896 ms | 143 ms |
| https://internet2.edu/services/amazon-web-services | 127 | 10 | 57 | 93 | 8,622 ms | 2,896 ms | 143 ms |
| https://internet2.edu/demo-achieves-post-quantum-cryptography-on-the-internet2-national-backbone | 48 | 12 | 56 | 91 | 8,105 ms | 2,896 ms | 143 ms |
| https://internet2.edu/community/about-us/executive-leadership/michael-d-erickson | 19 | 10 | 71 | 92 | 7,784 ms | 2,896 ms | 143 ms |